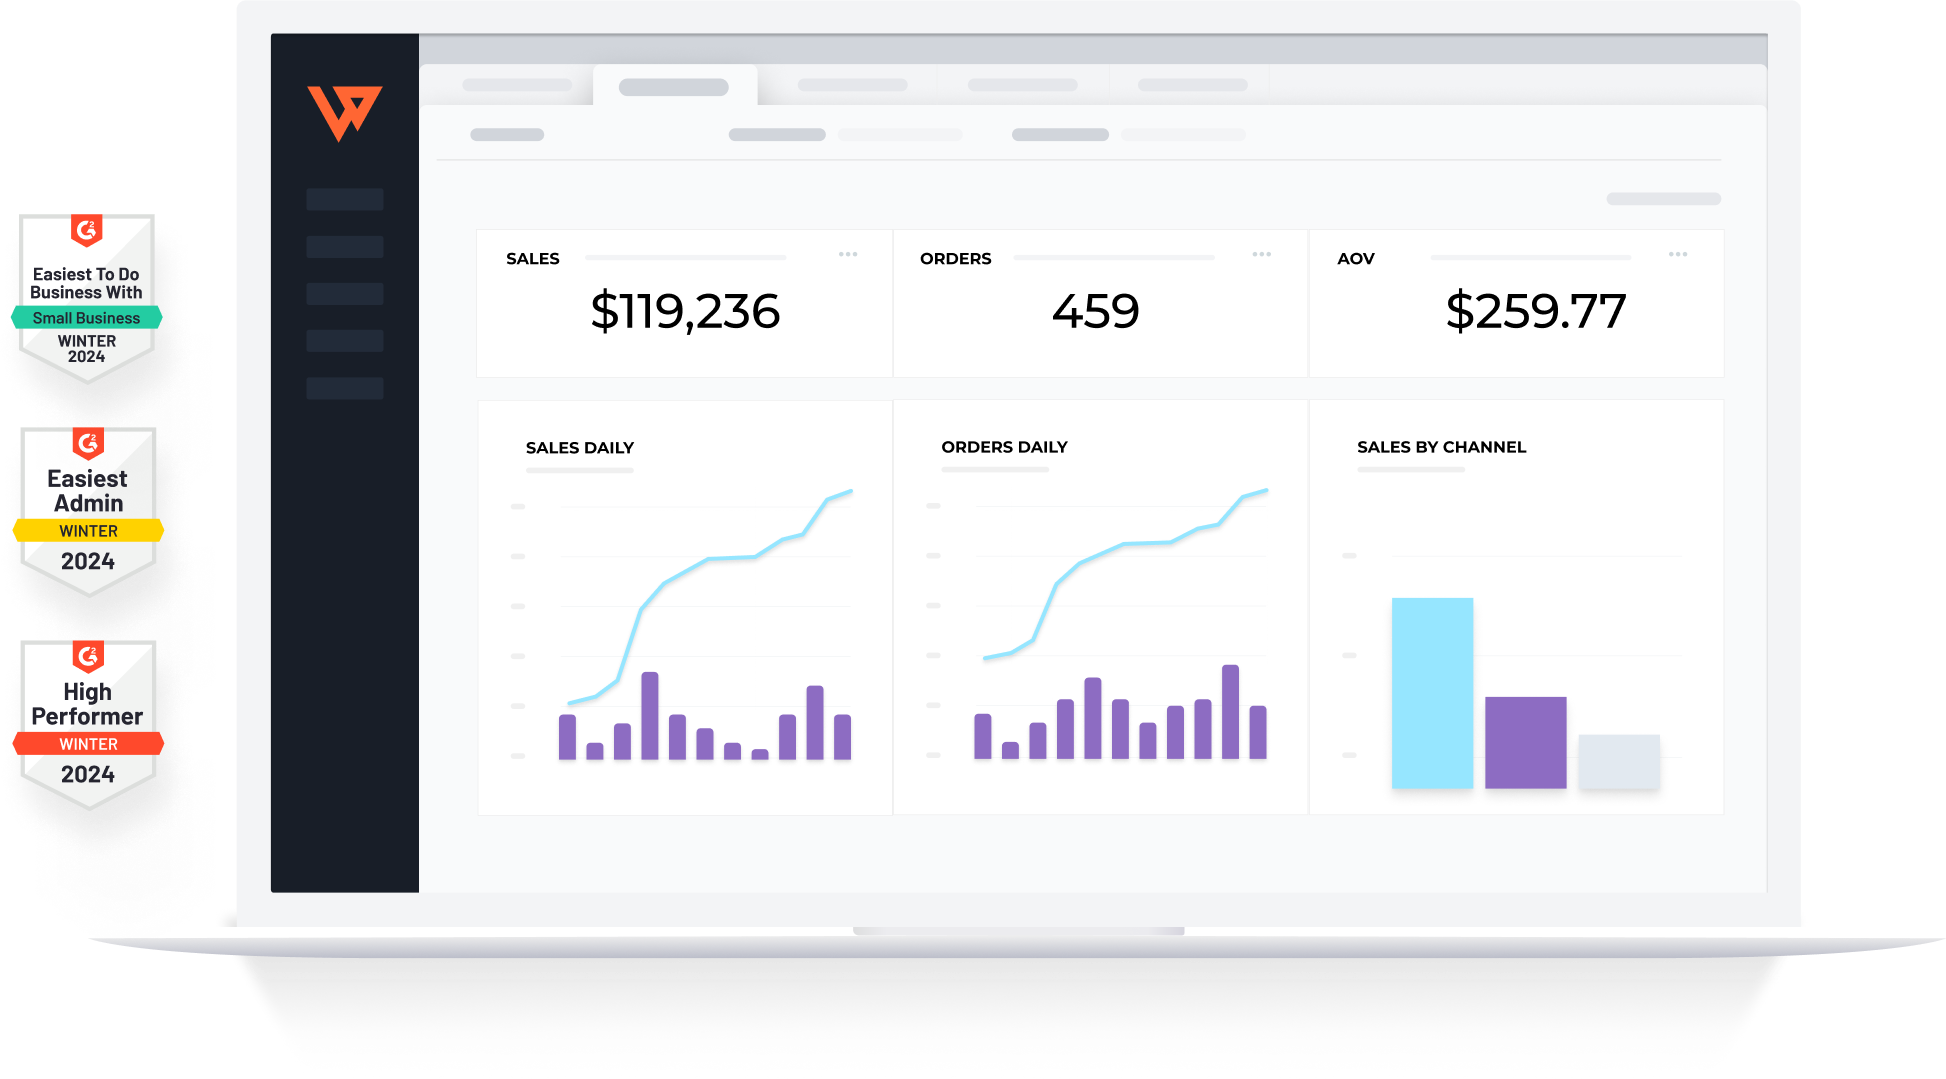
See the performance of all your channels in one place
Webgility captures channel- and SKU-level performance data to uncover growth opportunities – and show you where to scale back. Identify more ways to save with a complete breakdown of fees and expenses across your entire operation. Make data-informed decisions about where to invest your time and energy.
Revenue
Expenses
Margins
Cash flow
Marketplace fees
COGS
Products
Customers
Channels
Shipping costs


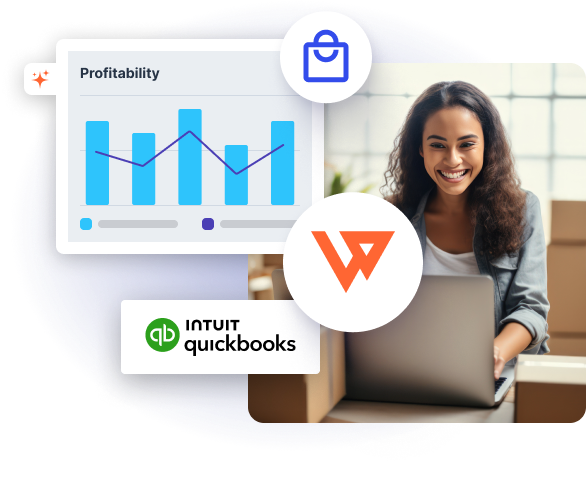
Turbocharge QuickBooks reporting
Webgility captures all your ecommerce sales and expenses at a summary or granular level into your accounting so you can generate powerful reports.
Get a true picture of your income and expenses by sales channel or payment processor.
Analyze your margins, marketplace fees, and shipping costs in depth.
Ditch the spreadsheets and dive into Webgility's analytics for even more powerful reports including pivot tables.


Real-time reports are available for Webgility customers who use QuickBooksOnline and subscribe to our Pro, Advanced, or Premium plan, which starts at $99 per month when billed annually.
Real-time reports are also available for Webgility customers who use QuickBooks Desktop and subscribe to our Advanced or Premium Plan, which starts at $199 per month when billed annually.
Webgility Analytics gives you more than 70 actionable insights, such as:
- Monthly and daily sales performance
- Monthly, weekly, and daily sales trends
- Month-over-month and year-over-year channel performance comparisons
- Best- and lowest-selling products in each channel
- Products producing the highest revenue
So much!
Webgility can help automate your bookkeeping workflows to significantly reduce errors in your books and easily expand to new sales channels.
Webgility can help you stay on top of your ecommerce business with real-time data sync for orders, expenses, prices, fees, and more.
Webgility can help you gain control of your assets with a real-time inventory sync that updates item counts no matter where you sell – online or in person.
Real-time reports have never been more accessible