
Contents


You scaled your ads. Your ROAS looked great. Revenue grew.
Yet somehow profitability didn't.
At some point, every finance leader at a growing ecommerce brand runs into the same uncomfortable question: If our marketing performance is improving, why aren't our margins improving with it?
The answer is simple. ROAS was designed to measure advertising efficiency, not business profitability.
At the $1M–$20M GMV stage, that distinction becomes expensive. Because the gap between reported ROAS and actual profit is where margin quietly disappears.
In this guide, we'll show you exactly what hidden costs ROAS ignores, why high ROAS doesn't guarantee profitability, and how to build financial visibility that actually reflects your business. By the end, you'll understand the difference between throughput metrics (ROAS) and profit metrics (contribution margin).
What ROAS tells you, and what it leaves out
Return on Ad Spend (ROAS) measures how much revenue is generated for every dollar spent on advertising.
Formula:
ROAS = Revenue Attributed to Ads ÷ Advertising Spend
Example:
- Ad spend: $10,000
- Attributed revenue: $40,000
ROAS = 4.0x
On the surface, that sounds like success.
What ROAS tells you:
✓ Campaign efficiency (revenue per ad dollar measured by how efficiently ads generate sales)
✓ Channel comparison (which marketing channels generate more revenue per $1 spent)
✓ Whether a campaign is "working" relative to a benchmark
What ROAS does NOT tell:
✗ Whether you made profit on those sales
✗ Which channels are actually profitable
✗ Your true customer acquisition cost
✗ Whether you're funding losing channels with winning ones
✗ How your costs changed as you scaled
|
💡Key Insight: A high ROAS can mask a profitable business problem hiding right underneath your P&L. |
The hidden costs ROAS never shows you
When you ignore these line items, even your "4x ROAS" suddenly looks very different. Determining these costs will help you identify whether growth creates value, or erodes it:
1. Cost of goods sold (COGS)
For physical goods retailers or brands, COGS typically consumes 45–65% of revenue.
Example:
- Ad spend: $10,000
- Revenue: $40,000 (4x ROAS)
- COGS: 60%
Production costs consume $24,000 immediately. The remaining gross margin is now $16,000. Your "4x ROAS" suddenly looks a lot less impressive.
2. Fulfillment and 3PL
At the $1M–$20M GMV stage, most brands outsource logistics. Pick-and-pack, storage, and shipping costs consume 12–20% of revenue.
Example:
- Revenue after COGS: $16,000
- Fulfillment/shipping (15%): −$6,000
- Remaining gross margin: $10,000
Now your 4x ROAS has generated only $10,000 in actual margin. You still haven't accounted for payment processing, taxes, marketplace/platform fees, or refund setbacks.
3. Returns and refunds
Ad platforms attribute revenue at the point of purchase, not after the return window closes.
The issue: Most ecommerce platforms have 30–60 day return windows. Ad platforms measure ROAS on day 1.
Example:
- Meta reports: $100,000 attributed revenue ($25,000 Ad Spend - 4x ROAS)
- 60 days later: $20,000 in customer returns
- Actual revenue: $80,000
- ROAS reported: 4x. ROAS reality: 3.2x
This happens every single quarter. Your Q4 ROAS looks phenomenal. Your January return surge makes it disappear. Platform reports never adjust.
4. Payment processing
Stripe, PayPal, Shop Pay, Klarna, and Afterpay charge 1.8% to 3.5% per transaction.
Example ($5M GMV):
- 3% processing fee = $150,000/year
- That's often more than a full-time employee's salary
- It never appears in your ROAS calculation
At smaller scales, this is a rounding error. At $5M+, it's a line item you're paying for monthly.
5. Marketplace and channel fees
Amazon, Shopify, Walmart, eBay, Etsy, and wholesale platforms take their share before money reaches your bank account.
What actually happens:
- You sell a product for $100 using Amazon Seller Central
- Amazon keeps $15–$20 in referral and fulfillment fees
- You receive $80–$85
- ROAS counts the full $100 as revenue
The gap: You're measuring sales, not the revenue you actually keep.
This varies wildly by platform:
- Amazon Marketplace: 15–50% (depending on FBA)
- Walmart Marketplace: 8–15%
- eBay: 12.9% + payment fees (17-21% total)
- Shopify: 2.9% + payment processing
- Etsy: 6.5% listing + transaction fees
Suggested read: How to Maximize Amazon Profit: The Complete Seller's Audit Guide
6. Discounts, promotions, and channel-specific deductions
Seasonal discounts, loyalty programs, and wholesale markdowns reduce your actual revenue per transaction without showing up in ROAS reports.
Example: You run a "Free shipping on orders $75+" promotion.
- ROAS counts the full order value
- Your fulfillment cost reduces the shipped margin
- Discount impact happens silently
After considering all these costs:
|
COGS − Fulfillment/3PL − Marketplace/Channel Fees − Payment Processing − Returns/Refunds − Tax Reserve = Net Revenue After Costs Net Revenue After Costs - Ad Spend (already allocated) = Contribution Margin |
What trusting ROAS alone is actually costing you
At $1M–$20M GMV, these aren't rounding errors. Each one is a line item with a dollar figure attached.
1. You're funding a losing channel with your winning ones
Blended ROAS of 3.8x sounds healthy. Underneath it: branded Google at 14x, email at 9x, Meta prospecting at 1.3x. The average flatters everything, and masks the channel quietly burning cash.
What it costs: (Real-world example)
$5M GMV brand spends $1M annually on marketing.
- 20% of spend on 1.3x ROAS channel = $200K annual spend
- At 1.3x, you're generating $260K revenue on $200K spend
- After a 55% COGS, you keep ~$117K
- MINUS fulfillment (15%): $39K gone
- MINUS fees (8%): $20.8K gone
- You're generating ~$57.2K on $200K spend
- This channel is destroying $142.8K in margin annually
Blended ROAS hides this. You can't see it until you break reporting by channel.
Fix: Break every report by channel → campaign type → new vs. returning. A blended number is not a decision-making tool.
2. You're paying for conversions that were never yours to win
Meta's default attribution claims credit for anyone who saw your ad and later purchased, whether they clicked or not.
This is called view-through attribution, and it inflates reported conversions by 30–70%.
Real impact:
- Meta ROAS reported: 3.2x
- With 40% view-through inflation: true click-based ROAS = 1.9x
- On a $500K budget, that's the difference between a profitable channel and one that barely works
Fix: Meta Ads Manager → Attribution Settings → 7-day click, 0-day view-through. Your ROAS will drop. That's the point.
3. You're paying to intercept customers who were already coming
Branded search generates 10x–15x ROAS. But those customers had already decided to buy. You're bidding on your own name and calling it performance.
What happens:
- High branded ROAS inflates your blended number
- Your team sees great metrics
- Budget gets allocated to the wrong channels
- True prospecting performance (which is actually lower) gets underfunded
Fix: Separate branded and non-branded into distinct reporting. Non-branded ROAS is your real growth number.
4. Your Q4 ROAS looks great until January's returns arrive
Platforms measure performance at point of sale. Returns land 30–60 days later. The reported ROAS never adjusts.
What it costs: $3M Q4 GMV with a 22% return rate = $660,000 in revenue that disappears after the measurement window closes. Next year's budget gets set on the inflated number.
Fix: Run a return-adjusted ROAS analysis 60 days after every major campaign. Use that number for planning, not the platform's figure.
5. You're scaling on an LTV number you've never validated
Low-ROAS acquisition campaigns can make sense if customer lifetime value justifies the cost. The problem is most LTV projections are built on best-case cohorts or outdated data.
The trap:
- 1.8x ROAS campaign
- But LTV is 24 months, so the math works
- The foundation? Often based on outdated data or your best customers, not average ones
- You approve the spend
- 12 months later, retention numbers prove the LTV was wrong
- The cash is gone
Fix: Before approving LTV-justified spend, ask for 12 months of cohort data from that specific channel. No data = No approval.
The real cost: Two $5M brands, $630K apart
Both brands below are rational, well-run operations. The only difference is which metrics sit on their dashboards.
|
Metric |
Brand A |
Brand B |
|
Blended ROAS |
4.4x |
2.6x |
|
Gross margin |
38% |
54% |
|
CMpO |
$37 |
$94 |
|
nCAC |
$72 |
$58 |
|
Payback period |
9.4 months |
3.8 months |
|
Net contribution margin |
2.1% |
14.7% |
What's different?
Brand A optimizes for ROAS. They scale the efficient channels, hit great platform numbers, and can't explain why the bank account is empty.
Brand B tracks contribution margin. They know exactly which channels are profitable after every cost. When a difficult quarter comes, they have room to absorb it.
The gap isn't from different markets. It's from different dashboards.
What you need to fix the ROAS problem
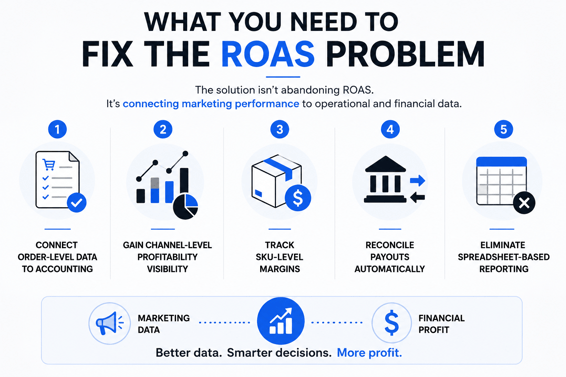
For this you need a framework: From ROAS to Contribution Margin.
Ad platforms measure what benefits them, not what helps you. You need to build this visibility yourself.
Order data lives in Shopify. Marketplace settlements live in Amazon and Walmart. Fees are buried in payout reports. Returns arrive weeks after the original sale. Accounting teams spend month-end exporting spreadsheets, reconciling transactions, and trying to piece together what actually happened.
As order volume grows, maintaining this level of visibility manually becomes increasingly difficult.
This is where the right financial infrastructure matters.
Webgility helps ecommerce brands move from platform-reported performance to true financial visibility by bringing these five requirements together in a single, continuously reconciled workflow.
The infrastructure Webgility builds looks like this:
- Order-level transaction data: Every order, fee, refund, and adjustment is recorded individually, giving finance teams the transaction-level detail needed to calculate contribution margin accurately.
- Real-time reconciliation: Instead of waiting until month-end to identify discrepancies, transactions are continuously synced and reconciled across ecommerce, marketplace, payment, and accounting systems.
- Unified cost mapping: Marketplace fees, payment processing costs, fulfillment expenses, discounts, and other transaction costs can be mapped to the financial records that generated them, creating a clearer picture of channel profitability.
- Accurate returns accounting: Returns and refunds are captured as they occur, helping financial reports reflect actual retained revenue rather than point-of-sale revenue alone.
- Certified books closing: Beyond software, Webgility's accounting specialists help ensure books are reconciled and validated, giving finance leaders confidence in the numbers they use to make decisions.
The goal isn't simply better reporting. It's having financial data you can trust when deciding where to invest, what channels to scale, and how profitable your growth really is.
ROAS is a signal. Contribution margin is the score.
The reason why most brands are never able to solve the ROAS problem is that it isn't actually the problem. The real problem is that most ecommerce financial systems were never designed to show contribution margin at the order level.
And, you can't optimize what you can't trust!
That's why leading operators are moving away from dashboard metrics and toward always-reconciled financial infrastructure.
Are you ready to scale on real data, not ROAS?
FAQs
Why can a high ROAS still mean low profitability?
ROAS measures revenue generated from ads, not profit. It excludes costs like COGS, fulfillment, returns, payment fees, and marketplace charges, which can significantly reduce margins.
How do ecommerce CFOs measure channel profitability?
CFOs combine ad spend with order-level costs such as COGS, fulfillment, fees, and returns to determine how much profit each channel actually generates.
What should ecommerce brands track besides ROAS?
In addition to ROAS, ecommerce brands should track contribution margin, customer acquisition cost (CAC), payback period, and channel profitability to understand true business performance.
.png?width=56&height=56&name=image%20(9).png) Nikita Sikri
Nikita Sikri


