
Contents


Imagine a fast-growing fashion brand doing millions in annual revenue.
As the summer season winds down, the team is deciding which products to discount, reorder, and promote. One SKU seems like the obvious winner. It's the bestseller, dominates revenue reports, and delivers a healthy ROAS.
So they double down.
The problem? After accounting for fulfillment costs, marketplace fees, returns, ad spend, and other operational expenses, that "hero" product contributes far less profit than expected. Meanwhile, a quieter SKU generates significantly stronger margins.
This is the bestseller illusion: making smart decisions based on numbers that don't tell the full financial story.
In this post, we'll show you how to calculate profit per unit, identify low-margin bestsellers, and make better pricing, inventory, and growth decisions using complete profitability data.
You made the right call. With the wrong numbers.
Revenue doesn't equal profit.
If you've been pouring ad budget into your bestseller, prioritizing it in inventory planning, and building your brand story around it, that wasn't a mistake. That was the logical thing to do, given what your reports were telling you.
Your Shopify dashboard showed it as the top revenue driver. Your ad platform showed a healthy ROAS. Your inventory reports flagged it as your fastest-moving product. Every signal pointed the same direction.
The problem: none of those signals were measuring profit. Revenue rank isn't profit rank. ROAS doesn't account for FBA fee changes, return rate spikes, or fulfillment cost shifts. Unit velocity tells you what's selling, not what's making you money.
You weren't making bad decisions. You were making decisions based on metrics that were never designed to show you profit.
Let's look at how this calculation works in practice
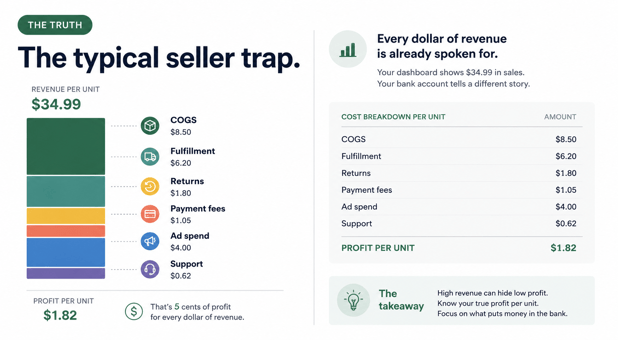
Here's an example of a $34.99 SKU sold primarily through Amazon FBA, with Shopify as a secondary channel:
|
COGS Landed cost (manufacturing, freight, duties, packaging) |
$8.50 |
|
FBA Fulfillment Fee (Pick, pack, ship- per unit, at current tier) |
$4.40 |
|
Referral Fee Amazon (15% on $34.99) |
$5.25 |
|
Returns Cost (9% return rate- two-way shipping and processing, spread across units) |
$1.80 |
|
Payment Processing (Blended across channels) |
$0.82 |
|
Attributed Ad Spend ($40K Sponsored Products spend to move 10K units through paid) |
$4 |
|
Support Overhead (20% of support time on this SKU, allocated per unit) |
$0.62 |
|
Total Cost |
$25.39 |
Real Profit Per Unit: $34.99 - $25.39 = $9.60
Multiply $9.60 by 18,000 units and you have $172,800 in annual profit. That number changes substantially the moment Amazon adjusts its FBA tier, your return rate spikes, or a fee structure shifts mid-quarter.
The problem: Those fee changes hit your Amazon settlement. If your books aren't reconciling each settlement line by line against your orders, the change doesn't appear in QuickBooks as a classified cost. It disappears into a net deposit. Your QuickBooks P&L still shows the old margin. Your decisions follow it.
What incomplete data is costing you
When your books reconcile at settlement level instead of order level, you make three expensive mistakes without seeing them:
1. Inventory based on revenue rank, not profit rank
The bestseller moved 18,000 units and generated the most revenue. So when fall manufacturing decisions come, you assume you should produce 22,000 units. The logic is sound. The data is wrong.
But what if that bestseller is only generating $8.67 per unit in real profit, while a quieter product, a specialized shapewear style that sells 4,000 units at $54.99 is generating $12.40 per unit?
The revenue story: Bestseller drives $630K. Shapewear drives $220K. Keep making bestsellers.
The profit story: Bestseller = $156K profit. Shapewear = $49.6K profit. Bestseller is still ahead. But what about the cash burn?
Every unit of the bestseller requires $26.32 in cost outlay before you see revenue. With 18,000 units, that's $473,760 in cash tied up across manufacturing, inbound freight, Amazon storage, and pending payouts. The shapewear, selling at higher margin, converts cash faster and doesn't require the same inventory depth.
The decision to make more bestsellers is logical given the revenue data. It's financial disaster given the profit data.
2. You can't see when discounts destroy margins
Mid-season, velocity slows on the bestseller. The instinct: run a promotion.
A 20% discount brings volume back. Shopify dashboard shows revenue recovery. But what's the actual impact?
With order-level reconciliation (what Webgility provides):
You see immediately: This discount reduced per-unit profit from $8.67 to $4.30. To break even on total profit dollars, you'd need velocity to increase by 102%. Historical data shows you'll get 35% volume lift. The discount is a loss.
Without order-level reconciliation (what most fashion brands operate with):
You see: Revenue went up. You assume profitability followed. Three months later, when you close the quarter, you realize the blended margin for the entire product line dropped 2 points. You can't identify which promotion caused it or what the actual damage was. You make the same discount decision next season.
3. You're financing a cash-burning cycle without knowing it
This is the most dangerous one for scaling brands. A high-volume, low-profit SKU operates on a cash cycle:
- Manufacturing run: $200K committed
- Inbound freight: $12K
- Amazon storage (Q3/Q4 especially): $3K per month
- FBA fulfillment: $5.20 × 18,000 units = $93.6K
- Total cash outlay: $308.6K before first sale
Amazon settles 7-14 days after shipment. By the time revenue deposits, you've already funded the next manufacturing run. If profit per unit is razor-thin ($8.67), you're running a high-volume cycle that returns less than it consumes.
Revenue looks healthy: $800K monthly. Cash feels tight: three-week payroll runway. And no one can explain why.
From bestseller illusion to operational truth
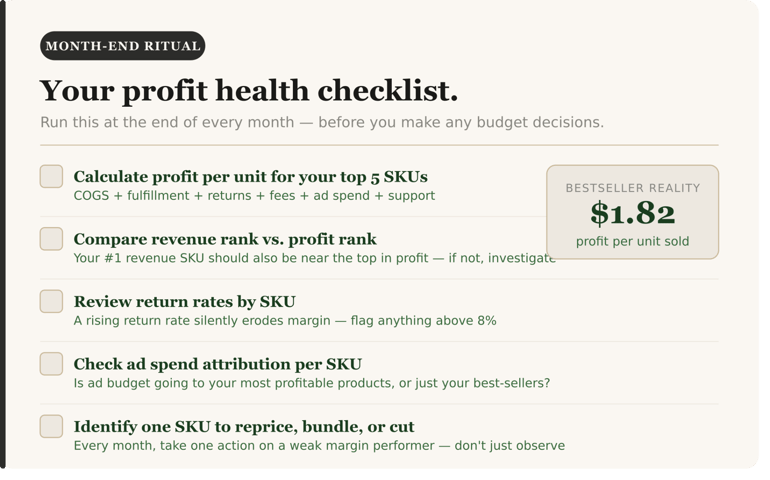
Here's how to break the bestseller illusion in your own business:
Step 1: Calculate Profit Per Unit by SKU
Use this formula for each SKU you stock:
|
Real Profit Per Unit = Selling Price − (COGS + Channel Fulfillment + Marketplace Fees + Returns + Payment Processing + Attributed Ad Spend + Overhead) |
For fashion brands selling multi-channel, do this “per channel”. A SKU profitable on Shopify might be unprofitable on Amazon due to FBA fees.
Step 2: Rank by contribution dollars, not revenue
Multiply profit per unit × Annual units sold = Contribution profit dollars
This is not the same as revenue rank.
|
SKU |
Units Sold |
Profit Per Unit |
Total Contribution |
Revenue |
|
Monochrome basics (bestseller) |
18,000 |
$3.25 |
$58,500 |
$630,000 |
|
Premium shapewear (quiet SKU) |
4,000 |
$12.40 |
$49,600 |
$220,000 |
|
Seasonal basics |
8,500 |
$11.20 |
$95,200 |
$297,500 |
Revenue rank: Bestseller → Seasonal → Shapewear
Profit rank: Seasonal → Bestseller → Shapewear
The “bestseller” generates more than twice the revenue of the next-highest SKU. But once you account for fulfillment costs, marketplace fees, returns, and advertising spend, its contribution drops dramatically.
The “seasonal basics” SKU generates less than half the revenue, yet contributes significantly more profit to the business. If you're making inventory, pricing, or advertising decisions based on revenue alone, you're likely investing in the wrong products.
Step 3: Map the cash cycle
For each top-10 SKU:
- How much cash is tied up in manufacturing before first sale?
- How long is the settlement cycle (order to deposit)?
- What's the working capital requirement?
A $300K manufacturing run that generates 6% margin ties up more capital than a $80K run that generates 18% margin. The second is better for cash flow.
Step 4: Get real-time visibility
Once you've mapped your actual profitability, the next step is ensuring that visibility continuous.
This is where settlement-level accounting breaks down. Your FBA fees change. Return rates spike. Ad costs shift. Exchange rates move. A margin number from last month is already stale.
You need order-level reconciliation: every order posted individually to your accounting system, with fees and fulfillment costs classified as they hit, inventory updated automatically, returns reconciled in real-time.
When that infrastructure exists, you stop guessing. You can see in real-time:
- Which SKUs, channels, and product combinations are actually profitable
- When a fee structure change impacts margins
- Whether a discount is working or destroying value
- If your cash flow is sustainable or burning
The Webgility framework: How order-level reconciliation solves this
Webgility gives multichannel ecommerce operators reconciled, accurate books, without the manual work. Here's how it works for fashion brands specifically:
1. Order-level posting

Profit visibility starts with reconciliation.
Every Shopify order, Amazon transaction that include FBA fees, storage, and returns are posted individually to QuickBooks, not as a daily settlement summary. This means:
- A $34.99 sale posts with its actual fulfillment cost ($5.20 FBA fee)
- The $5.25 referral fee posts to the correct account
- A return refund updates inventory immediately
- Ad spend is attributed by channel and order
2. Real-time inventory sync
Inventory updates across Shopify, Amazon, and your backend simultaneously. No more phantom counts. No more "I thought we had 200 in stock but we actually have 80.
For fashion brands, this is critical because:
- You need accurate stock levels by size/color/style to avoid oversells
- Inventory allocation decisions depend on true available stock
- Returns need to reconcile back to available inventory, not just revenue
3. Settlement reconciliation
When Amazon deposits $$142,500 on Thursday, Webgility ties that deposit back to the 847 orders that created it. You see the breakdown:
- Revenue: $170,000
- Less FBA fees: -$12,400
- Less referral fees: -$8,900
- Less refunds: -$6,200
- Net deposit: $142,500
(Numbers shift slightly in real reconciliation, but the principle is the same.)
This is not possible with traditional accounting software. QuickBooks records the deposit. Webgility connects it to the orders that created it.
4. Margin visibility by SKU, channel, and order
Once order-level data flows into your books, you can run queries like:
- What's the actual net profit on the monochrome basics bundle, by channel, after all fees?
- Which product combinations are we bundling that improve blended margin per order?
- If we increase the price 5%, what's the projected margin change?
The audit to run this week
The brands that scale profitably don't run one-off audits. They build systems where profit visibility is always on, not something you calculate after the quarter closes.
That means connecting cost data, fulfillment, returns, and ad spend into a single view where profit per SKU, per order, and per channel is visible in real time, not reconstructed after the fact.
When that infrastructure exists, the questions change. You stop asking "why isn't this business more profitable?" and start asking "which of these decisions moves the profit number most?" That's the shift, from reacting to incomplete data to running on complete data.
Want to see what order-level profit visibility looks like in practice? [See how it works]
When every order reconciles, your bestseller stops lying to you.30 minutes. Channel-by-channel. We'll show you what order-level reconciliation produces in QuickBooks and where your current books have gaps. |
.png?width=56&height=56&name=image%20(1).png) Yash Bodane
Yash Bodane


